
I ask questions in this post, they are not rhetorical. If you have answers, please contact me on https://climatejustice.social/@PenguinJunk.
I’ve been interested for a while in creating visualisations of the flow of money through the UK. I feel we say a lot about “the economy” but so much of what is understood is more about ideology than reality. I’ve often wondered what it would look like to visualise the flow of money from public and private investment into public services and private enterprise and from there into peoples’ and investors’ pockets. Where does this money then go - how much goes back to be invested in society, and how much goes out to languish in the bank accounts of the wealthy? We all believe we understand the scales of these flows, but do we really? Who has done this work and where are those data?
I have returned to this thinking this week after attending a discussion with representatives of local voluntary groups. The discussion was about the plans for our city, Southampton, my home for 3 decades. The conversation was insightful. Others in attendance spoke about how their organisations support abuse and rape survivors, people struggling with substance misuse and other serious health issues. They all identified that over recent years it has been even more difficult to support the increasing needs of individuals using the decreasing funding the organisations are receiving. These organisations do amazing work, but they spoke with emotions about having people on extremely long waiting lists, even after they may have taken years to get to the point of being able to ask for help. The main story was “we need more funding”.
The event had started with a short presentation and quiz about Southampton, in data including figures about population, health and the economy, the latter being wrapped into something called Gross Value Added. Whilst this was interesting, it wasn’t much use in the subsequent discussion, and one strong polarity struck me: Whilst it was inarguable that more support was needed for the services that people were doing their best to offer, there were very different opinions about how that funding could be gained.
The default opinion was that the Council needs to bring investment into commercial interests in the city. By investing in, for instance, a commercial district, the Council’s income increases and they can provide more to the support services. However, others, who have seen these attempts at investment over the years, had a different perspective. They felt that this investment brought in large corporate players who then syphoned the investment out of the city. This second argument also wrapped in a civic pride, that Southampton has some unique qualities that previous efforts have undermined by destroying our local enterprises and characterful districts. Who is right? Or at least, how much of each narrative plays out in reality?
Again, I wondered how much of the money previously invested remained in the city, ultimately. Where can I find those figures?
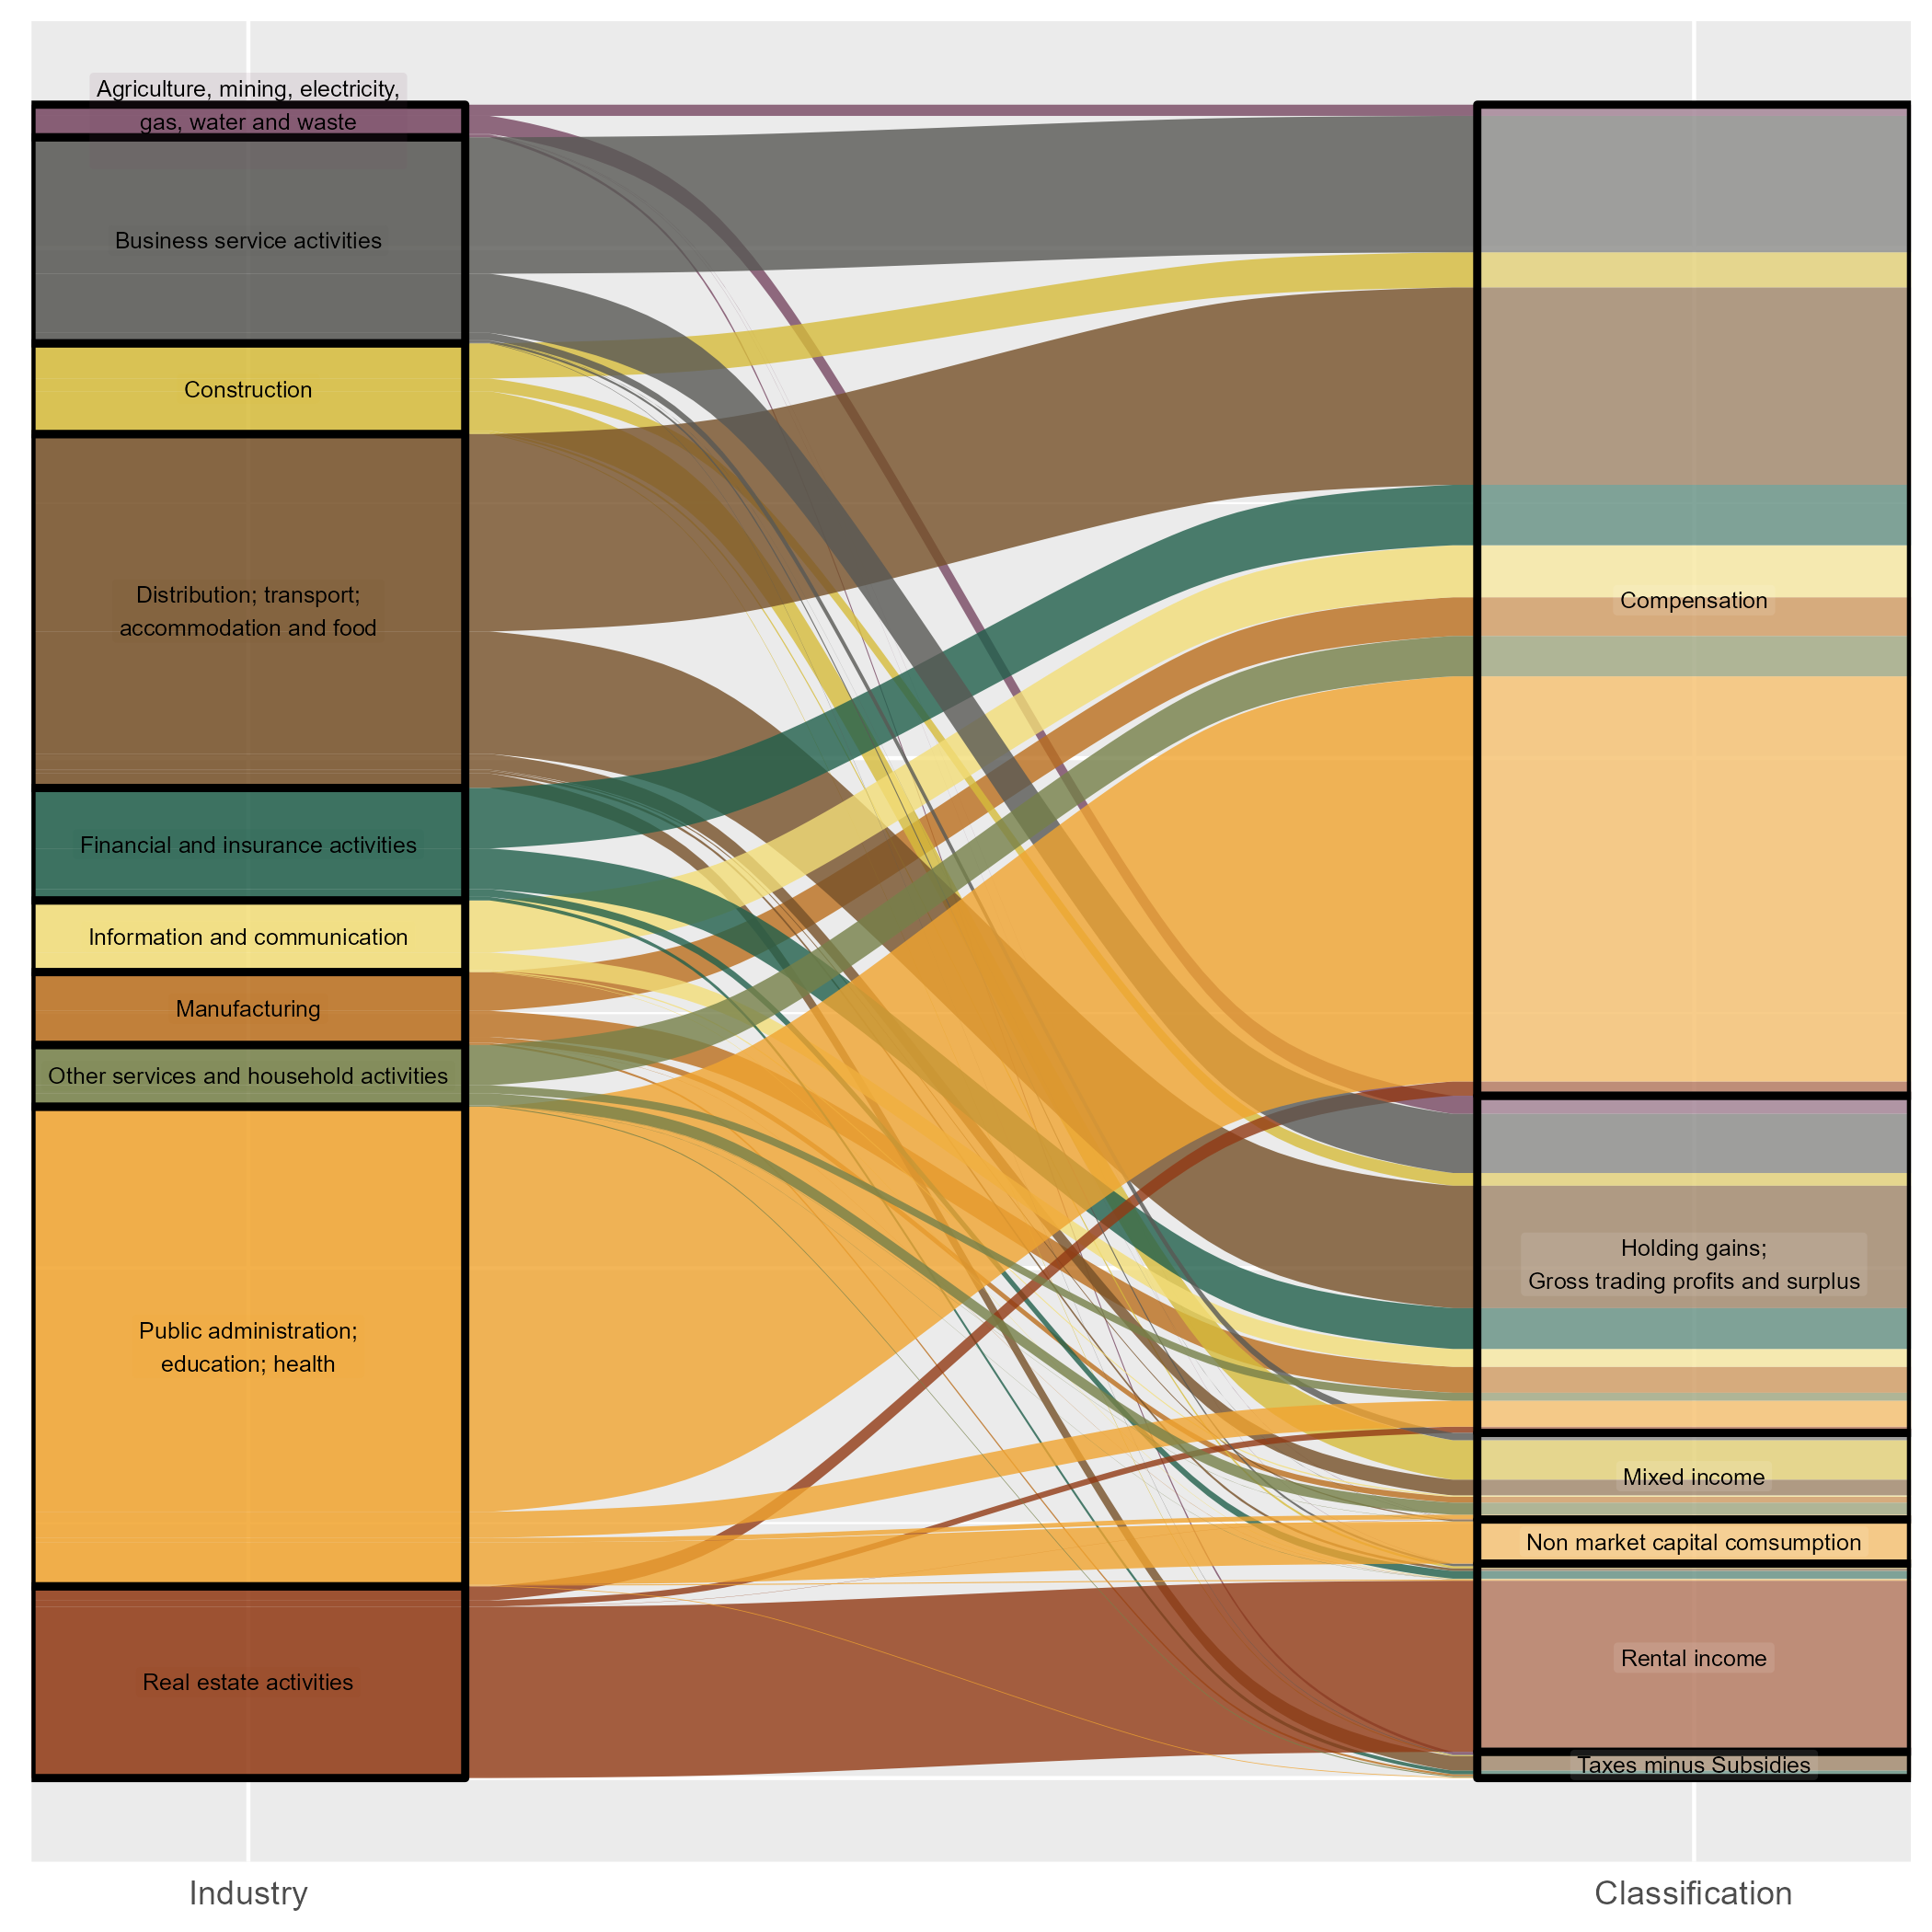
Figure 1: Mapping showing Southampton Gross Value Added for 2017 (provisional) and how it derives from each industry. This figure needs plenty of work, but serves to show some headline features such as the proportion that each industrial sector contributes to pay (“Compensation”) and how much goes elsewhere.
Unable to find data on money flows, I returned to the Gross Value Added (GVA) numbers that were given at the start of the discussion. These were introduced as “a bit complicated”, but actually aren’t particularly complicated. I found data up to 2017 that broke down GVA for industry sectors (to produce Figure 1). The version of GVA being used (GVA Income Approach) is, crudely, a sum of how private and public sector have spent or saved money within some frame (time/region/etc)1. This is a measure of economic activity. However, I would argue that it is not a measure that has much meaning to most people (much like its pal, GDP).
Our discussion had two clear narratives around money flows within our city. These narratives combined both economic insights and interpretations about what that means to people. We need data that shines a light on how these money flows truly affect people in our city. Thankfully, there is already some work underway with Southampton Climate Action Network (SoCAN) looking at this: Doughnut Economics Blog.
Comments powered by Disqus.